
For anyone getting started with pay-per-click (PPC) advertising, it can seem like a complex puzzle. There are so many PPC metrics to understand and track. We feel you!
PPC is a powerful tool for driving traffic, generating leads, and boosting sales. So how can you make the most of it? Fortunately, PPC automation has simplified most of the work in the campaign management process.
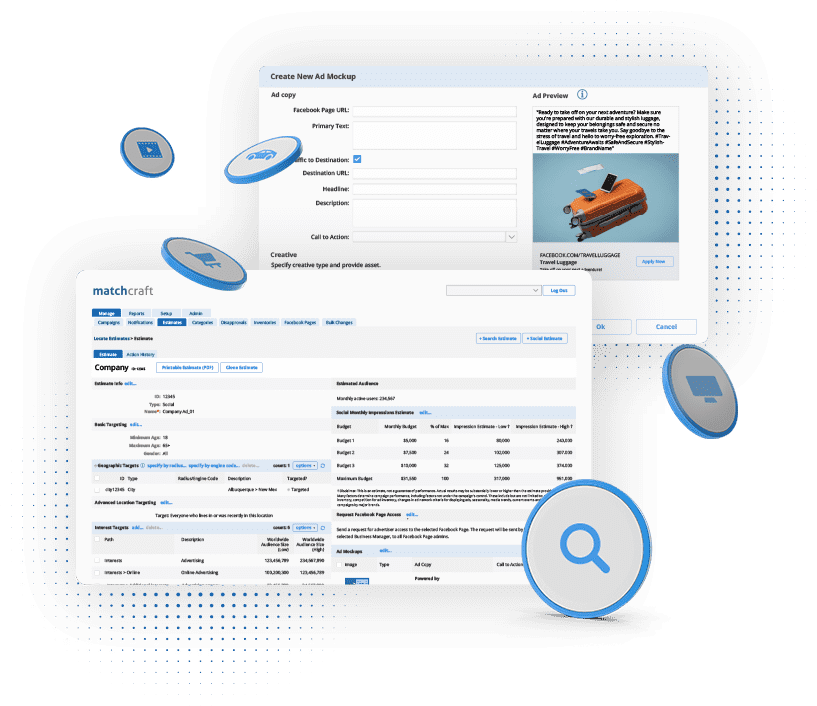
With MatchCraft’s suite of tools and solutions, you can easily manage all your PPC campaigns in one place. However, you need to understand the meaning of each PPC metric to track and analyze the campaign’s success.
This blog post will be your one-stop solution to master all the important PPC metrics. Let’s dive in.
1. Click-Through Rate (CTR)
Click-through rate (CTR) is an important metric in PPC that measures the percentage of users who click on your ad after seeing it. Essentially, it tells you how effectively your ad is capturing the interest of your audience.
Why Does CTR Matter?
Click-through rate directly impacts your Quality Score. So, having a higher CTR translates to a higher Quality Score, which ultimately helps you get a better ad position with minimal costs.
However, a higher click-through rate with a low conversion rate can be bad for your PPC campaign due to irrelevant traffic. Making changes to your keyword strategy and ad copy will enhance your CTR.
How to Calculate Click-Through Rate
To get the CTR percentage, divide the number of clicks by the number of impressions and multiply the result by 100.
Click-Through Rate = (Number of Clicks / Number of Impressions) x 100
What Is a Good Average CTR?
The average CTR may vary for different industries. However, for Google Search Ads, the average CTR across industries is around 3.17%, and for Google Display Network, it’s around 0.46%. This benchmark can help you gauge how your ads perform compared to the competition. Try to maintain a CTR that is slightly higher than the average.
How to Improve Click-Through Rate?
- Craft compelling ad copy that resonates with your target audience and highlights the benefits of your product or service.
- A powerful call-to-action (CTA) can significantly boost your CTR. Phrases like “Learn More,” “Get Started,” or “Shop Now” can encourage users to click on your ad.
- Use negative keywords to avoid irrelevant traffic and budget wastage.
- Add sitelink extensions to add more information to your ad.
- Running your PPC ads during the best time of the day will help increase CTR.
2. Conversion Rate
Conversion rate is a critical metric that measures the percentage of users who complete a desired action after clicking on your ad. This action could be anything from making a purchase to signing up for a newsletter or filling out a contact form.
A good conversion rate indicates the success of your PPC campaigns. A poor conversion rate urges you to modify your strategies quickly; otherwise, you could be attracting irrelevant traffic and losing money.
How Is Conversion Rate Calculated?
Calculating your conversion rate is straightforward. Divide the number of conversions by the number of clicks, and multiply the result by 100.
Conversion Rate = (Number of conversions / Number of Clicks) × 100
For example, if you have 50 conversions from 1000 clicks, the average conversion rate would be 5%.
On average, Google Ads’ conversion rate is around 3.75%. However, there is no clear-cut answer. It can be much higher, depending on your PPC strategy.
Factors Affecting Conversion Rates
- Landing Page Experience: A well-designed, user-friendly landing page that matches the ad’s promise can lead to higher conversion rates.
- Ad Relevance: Ensuring that your ads are highly relevant to the target audience increases the likelihood of conversions. Misleading or irrelevant ads can drive traffic but fail to convert.
- User Experience: A smooth, intuitive user experience from the moment the user clicks on the ad to the completion of the desired action is crucial. Complicated forms, slow loading times, and poor navigation can all negatively impact conversion rates.
- Call to Action (CTA): A clear and compelling CTA can make a significant difference.
Best Ways to Improve Conversion Rate
- Ensure your landing pages are relevant, fast-loading, and easy to navigate. A/B testing different versions of your landing page can help you find the most effective design and content.
- Use targeted keywords and create ads that directly address the needs and interests of your audience.
- Streamline the process for users to complete the desired action. This includes simplifying forms, reducing the number of steps required, and ensuring mobile-friendliness.
MatchCraft’s platform offers sophisticated conversion tracking capabilities that can help you monitor and analyze your conversion rates in detail. By providing insights into which ads, keywords, and landing pages drive conversions, MatchCraft enables you to fine-tune your campaigns for maximum effectiveness.
3. Cost Per Click (CPC)
Cost per click (CPC) indicates the amount you pay each time someone clicks on your ad. It’s a fundamental component that helps you understand the cost-effectiveness of your ads.
How to Calculate Cost Per Click
Divide the total cost of clicks by the total number of clicks.
Cost Per Click (CPC) = Total cost of clicks / Total number of clicks
For instance, if you spend $100 for 1000 clicks, then the CPC is $0.10.
What Is a Good Average CPC?
Industries like legal, health, and insurance command a higher average CPC than other industries. However, the average CPC across industries is approximately $2.69 for search ads, and $0.63 for display ads.
Factors Influencing CPC
- Competitive keywords
- Quality Score
- Click-through rate
- Long-tail and short-tail keywords
How to Reduce Cost-Per-Click
- Improve Quality Score: Focus on creating high-quality, relevant ads that match well with your keywords and landing pages. This can help improve your Quality Score and result in good cost per click.
- Optimize Keywords: Conduct thorough keyword research to find highly relevant long-tail keywords. Regularly review and update your keyword list to eliminate underperforming terms.
- Enhance Ad Relevance: Ensure your ad copy is directly related to the keywords and offers a compelling value proposition. This boosts your CTR and can lead to lower CPC.
- A/B Testing: Continuously test different ad variations to identify which versions perform best. Even small tweaks can lead to significant improvements in performance and cost efficiency.
- Bid Strategically: Use automated bidding strategies that adjust bids based on the likelihood of conversions, ensuring you’re getting the most out of your budget.
4. Quality Score
Quality Score is Google’s rating of the quality and relevance of your ads, keywords, and landing pages. This score, which ranges from one to ten, helps determine your ad rank and the cost per click (CPC) you pay for your campaigns.
Components Of Quality Score
Quality Score is based on the following three key components:
- Expected Click-Through Rate (CTR): This predicts how likely your ad will be clicked when shown. A higher expected CTR indicates that your ad is relevant and engaging.
- Ad Relevance: This measures how closely your ad matches the intent behind the user’s search query. Ads more closely aligned with what users search for are considered more relevant.
- Landing Page Experience: This assesses the quality and relevance of the page users are taken to after clicking on your ad.
Why Is Quality Score Important?
Quality Score is crucial because it directly impacts your ad rank and CPC. A higher Quality Score can lead to better ad positions and lower costs per click, making your campaigns more efficient and effective.
Strategies for Improving Quality Score
- Enhance the expected CTR by writing a compelling ad copy and including strong call-to-action and keywords that users will likely search for.
- Ensure your ads are closely aligned with the keywords you’re targeting. This involves understanding user intent and crafting ads that meet their needs.
- Ensure your landing pages are user-friendly, relevant, and provide valuable information.
- Continuously monitor your ad performance and make adjustments as needed.
- Identify and add negative keywords to prevent your ads from appearing in irrelevant searches, improving ad relevance and CTR.
Pro Tip: Improve your Quality Score by leveraging MatchCraft’s AI-powered ad optimization solutions to make your PPC campaigns efficient and cost-effective. 
5. Cost Per Acquisition (CPA)
Cost Per Acquisition (CPA) measures the cost associated with acquiring a customer through your ads. It tells you how much you’re spending to get each conversion, whether that’s a sale, a sign-up, or any other desired action.
How to Calculate Cost Per Acquisition
To calculate CPA, just divide the total ad cost by the total number of conversions.
Cost Per Acquisition = Total ad spend / Total number of conversions
What Is a Good Average Cost Per Acquisition?
The average CPA across various industries is approximately $48.96 for Google search ads, and $75.51 for display ads.
Tips for Reducing CPA
Follow these tips to acquire more customers at lower costs:
- Ensure your ads are shown to the right audience. Use detailed targeting options to reach users who are more likely to convert.
- Improve ad quality by creating relevant ads that attract more qualified clicks.
- Optimize your landing page for speed, ease of navigation, and clear calls to action.
- Focus on high-intent keywords that are more likely to convert and eliminate those that are driving up costs without yielding results.
- Use retargeting campaigns to reach users who have previously interacted with your site but didn’t convert. These users are often closer to making a purchase.
- Set up detailed conversion tracking to understand which ads and keywords drive conversions. This data can help you allocate your budget more effectively.
6. Return on Ad Spend (ROAS)
Return on Ad Spend (ROAS) is a key performance PPC metric that measures the revenue generated for every dollar spent on ads. It helps you understand the effectiveness of your advertising efforts in driving sales and generating income.
How To Calculate Return on Ad Spend (ROAS)
To calculate ROAS, divide revenue from ad costs by ad spend. To get the percentage of ROAS, multiply the result by 100.
Return on Ad Spend (ROAS) = Revenue attributed to ads / Ad spend
For example, if you have spent $5000 on ads and the total revenue is $15,000, your ROAS will be $3. You’re getting $3 for every $1 spent. In percentage, it is 300%. For the above example, your ROAS is usually written as 3:1.
Setting ROAS Goals
- Determine the Break-Even Point: First, calculate the break-even point where your ad spend equals your revenue. This helps you understand the minimum ROAS you need to avoid losing money.
- Align with Business Objectives: Set ROAS goals that align with your overall business objectives, whether it’s maximizing profit, scaling your business, or increasing market share.
- Industry Benchmarks: Use industry benchmarks to set realistic ROAS goals. This gives you a comparative baseline to strive for.
- Incremental Improvements: Start with achievable goals and gradually increase them as you optimize your campaigns.
Strategies for Improving ROAS
Focus your ad spend on audiences that are more likely to generate higher revenue. Use data to identify and target high-value segments and reach the most relevant audience. This reduces wasted ad spend and increases the likelihood of conversions.
Retarget users who have previously interacted with your site. These users are often more likely to convert, providing a higher ROAS. Lastly, use insights to adjust your strategy, focusing on the most effective channels, keywords, and ad variations.
Worried about achieving low ROAS? MatchCraft’s Search PPC Management Tool will help you maximize your ROAS by using advanced algorithms and real-time data to optimize your bids.
7. Impression Share
Impression share is the percentage of impressions your ads receive compared to the total number of impressions they were eligible to receive. It provides insight into your ad visibility and how often your ads are shown to your target audience.
To calculate the percentage of impression share, divide the impressions received by the total eligible impressions and multiply the result by 100.
Impression Share (%) = (Impressions received / Total eligible impressions) x 100
Why Is Impression Share Important?
Impression share is crucial for understanding your brand’s visibility in the competitive ad landscape. A high impression share indicates that your ads are being shown frequently to your target audience, enhancing brand awareness and increasing the likelihood of engagement and conversions.
How to Increase Impression Share
- If your budget is too low, your ads might not be showing as often as they could. So, increase your budget to capture more impressions.
- Run your ads during peak times when your target audience is most active.
- Focus on creating engaging and high-quality ads.
- Broaden your keyword list to include more relevant terms. This can help your ads appear in more searches, increasing your overall impression share.
- Refine your targeting settings to ensure your ads reach the right audience. Proper targeting can improve your ad’s relevance and increase its chances of being shown.
- Keep an eye on your competitors’ strategies to understand their approach and adjust your campaigns to capture a larger share of impressions.
8. Average Position (Historical Context)
Google Ads retired the average position metric in September 2019. The average position indicated the average rank of your ad in the auction, giving you a rough idea of where your ad appeared on the search results page. However, it didn’t provide a clear picture of the actual visibility of your ads.
For example, an average position of 1.5 could mean your ads were shown in either the first or second position, without specifying how often they appeared in the coveted top spots.
So, what are the best alternatives to average position?
Impression share is one of the best alternatives because it measures the percentage of impressions your ads receive. Similarly, top impression share shows how often your ads appear in prominent positions.
Absolute top impression share is another alternative that tells you the percentage of your impressions that appear as the very first ad above the organic search results. Lastly, Search Lost IS (Budget) metric shows the percentage of impressions lost due to insufficient budget, and Search Lost IS (Rank) indicates the percentage of impressions lost due to a low ad rank.
PPC is a dynamic model that keeps changing, and you must have better strategies to respond to those changes. MatchCraft’s PPC management solutions understand the dynamic nature of PPC advertising and offer advanced reporting tools to help you navigate these changes effectively. 
9. Customer Lifetime Value (CLV)
Customer Lifetime Value (CLV) is a key PPC metric that represents the total revenue you can expect from a customer throughout their entire relationship with your business. It’s a forward-looking measure that helps you understand the long-term value of your customers beyond just their initial purchase.
Why Is Customer Lifetime Value (CLV) Important?
CLV helps you shift your perspective from short-term gains to long-term relationships. This approach fosters customer loyalty, repeat business, and sustainable growth.
By understanding CLV, you can make informed decisions about how much to invest in acquiring and retaining customers. Plus, it allows you to allocate your marketing budget more effectively, ensuring you’re spending the right amount to attract and keep valuable customers.
CLV helps you assess the profitability of different customer segments. This insight enables you to tailor your marketing efforts to target the most valuable segments, maximizing your return on investment.
How to Calculate Customer Lifetime Value
Here’s a simple formula to calculate CLV:
CLV = (Average purchase value x Number of purchases per year) x Average customer lifespan.
Let’s break it down:
- Average purchase value: The average amount a customer spends per purchase.
- Number of purchases per Year: The average number of times a customer makes a purchase in a year.
- Average customer lifespan: The average number of years a customer continues to buy from your business.
10. Conversion Value
Conversion value helps you measure the return on investment (ROI) from your PPC campaigns. It’s not just about how many clicks or impressions you’re getting, but about the actual revenue or value those actions bring in. By focusing on conversion value, you can understand what’s really driving success and where to direct your resources for the best results.
Tips for Optimizing Conversion Value
- Target High-Converting Keywords: Use tools to analyze which keywords have the highest conversion rates and lowest cost per conversion. Use long-tail keywords that usually have lower competition and higher conversion rates. Also, include negative keywords to avoid irrelevant traffic.
- Improve Landing Pages: Your landing pages must align with your ad copy. A seamless experience from click to conversion can significantly boost your conversion rates. It loads faster and has clear call-to-actions.
- Implement Conversion Tracking: Use tools like Google Ads or other PPC platforms to track conversions accurately. UTM parameters are helpful for tracking how traffic from various sources and campaigns contributes to conversions.
11. Bounce Rate
Imagine someone walking into a store, glancing around, and then walking right back out without making a purchase. Bounce rate is similar to this scenario, where a user visits your website and leaves without taking any action.
A high bounce rate suggests that visitors aren’t finding what they’re looking for or are disengaged with your content. So, what can you do to reduce the bounce rate?
Let’s explore some of the effective strategies.
First impressions count! A cluttered and outdated design is a big turn-off. Your site must be visually appealing and professional. In addition to the design, ensure your site functions well on all devices, including mobile phones and tablets.
Speed matters! A slow site can frustrate visitors. Optimize your site’s load times. Tools like Google PageSpeed Insights can help you identify and fix speed issues.
Create content that grabs attention and keeps users engaged. Use compelling headlines, interesting visuals, and relevant information to hold their interest. Plus, your CTA should be easy to find and clearly state what action you want users to take.
Use relevant keywords in your PPC campaigns and SEO strategy to attract visitors who are genuinely interested in what you offer. This helps ensure that the traffic you’re bringing to your site is more likely to stay and explore.
How to Report on PPC Metrics to Clients
Business owners put so much money into PPC ads, expecting to boost sales and revenue. However, the hardest part is PPC account management, and reporting to clients is part of the process. You must know what to include and exclude in your PPC reporting.
The following tips will help you how to report on PPC metrics to clients:
- Define Clear Objectives: Understand your client’s goals and what they hope to achieve with their PPC campaigns. Align your report with these objectives to ensure it’s relevant and actionable.
- Simplify the Data: Highlight the most important PPC metrics, such as CTR, Conversion Rate, Cost Per Click (CPC), and Return on Ad Spend (ROAS). Avoid overwhelming clients with too much data. Additionally, incorporate charts, graphs, and tables to make data more digestible.
- Provide Context: Include explanations for any significant changes in metrics. For example, if there’s a spike in CPC, provide insights into potential causes and implications.
- Include Actionable Insights: Based on the data, offer specific recommendations for optimization. For example, if the CTR is low, suggest revising ad copy or targeting options.
- Tailor the Report: Customize reports based on the client’s level of expertise. For clients unfamiliar with PPC jargon, use simpler language and provide explanations for technical terms.
Leveraging PPC Metrics for Cross-Channel Strategies
To maximize the effectiveness of your digital marketing efforts, it’s essential to integrate PPC metrics with other channels like SEO, social media, and email marketing.
Here’s how you can create a unified strategy that leverages insights from your PPC campaigns’ KPIs across different platforms:
Unified Goals and KPIs:
Align your goals across all channels to ensure a cohesive strategy. For example, if your PPC campaigns are focused on driving traffic, your SEO and social media efforts should also aim to attract and engage users effectively.
Use cross-channel Key Performance Indicators (KPIs) to measure the overall success of your digital marketing efforts. Metrics like Customer Lifetime Value (CLV) and conversion rates can provide insights into how well different channels work together to drive customer engagement.
Data Integration:
Integrate data from PPC, SEO, social media, and email campaigns to get a complete view of your marketing performance. Tools like Google Analytics can be used to track user interactions across channels and understand their behavior and preferences.
Examine how users move between channels. For example, a user might click on a PPC ad, then visit your website through organic search, and later convert via an email campaign. Understanding these paths helps in optimizing your strategies for better results.
Optimize Ad Spend:
Use PPC metrics to inform budget allocation across channels. If you find that PPC campaigns are performing exceptionally well, consider reallocating the budget from underperforming channels to capitalize on this success.
Ensure that your PPC efforts complement other channels. For instance, if you’re running a social media campaign alongside PPC ads, use similar messaging and visuals to create a unified brand experience.
Improve Targeting:
If you identify high-performing customer segments through PPC data, apply these insights to your SEO and social media targeting strategies.
Adapt your content strategy based on cross-channel data. For example, if PPC metrics show that certain keywords or topics drive high engagement, use this information to inform your content creation for SEO and social media.
MatchCraft provides advanced tools and solutions for agencies that help you integrate and optimize your PPC efforts across various digital marketing channels. Contact us today to schedule a demo.
Author: Maria Selvam Amalraj