Google Analytics is jam-packed with features that give you an instant status on your website’s health, mishaps and opportunities. The only problem? Most marketers don’t have some of the best features of Google Analytics enabled—leaving opportunity for optimization on the table.
These five features of Google Analytics are just a few of our favorites:
1. Campaign Measurement: Traffic
Do you know which campaigns are sending you traffic? One of the tenets of marketing is relentless testing—but your efforts will only get you so far if you aren’t properly tracking your campaigns. Adding parameters to your URLs allows you to properly track campaigns and cuts out the guesswork.
Got something you want to track? The opportunities are endless: see which links in your newsletter are sending visitors to your website; see which partner ads are volleying you the most traffic; have confidence that someone is actually reading your guest blog posts.
Catching our drift?
Here’s the nitty gritty about parameters: you can either set them up manually or use a URL-builder. Google Analytics’ URL-builder is a good starting point.
There are five parameters that work:
- “utm_source”
- “utm_medium”
- “utm_campaign”
- “utm_term”
- “utm_content”
Use parameters with values that allow you to drill down to specifics that make sense for your campaign. For example, you may use the utm_source “holiday_mailer” with the utm_campaign as “Dec” to link parameters to your December holiday email campaign.
2. Track your Goals: Website conversions & user activity
The Google Analytics Goals feature feature tracks the most critical metric: conversions, (really, any activity or behavior you want your website visitors to do). It could be filling out a form, requesting a product demo, signing up for your email list, downloading an eBook, or completing a purchase.
Choose goals for specific pages of your website. Everything is tracked to the view level, and each time a user completes your desired goal, Google Analytics notes it as a conversion.
Goals can be categorized as:
- Destination (a path you want a website visitor to take)
- Duration (sessions that last for set amount of time, or longer)
- Pages/Screens Per Session (the number of pages a user has viewed in a set amount of time)
- Event (an action, such as a click)
You can create a funnel for your Destination goals. In this instance, map out the path you would expect a website visitor to take. Should they deviate—or abandon the path—you’ll immediately know where there’s an issue.
You can also assign a monetary value to each goal. This is a straightforward way to evaluate losses and gains and communicate results across the business, in a way everyone will relate to.
3. Audience reports: Know your users
Vague demographic data isn’t much use. You may use Google Analytics’ audience reports, but not to its greatest extent.
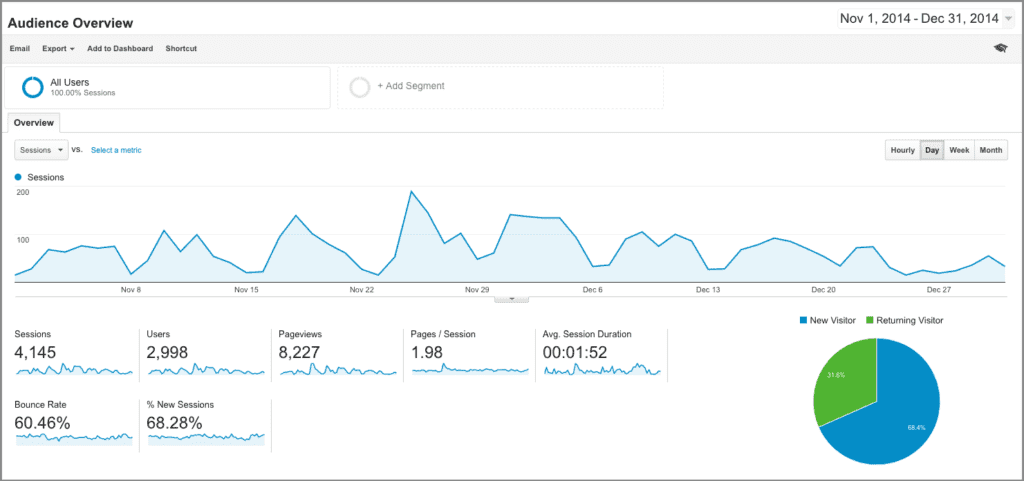
Audience reports offer a much more colorful picture of your customers, from demographics and geo-location to interests and key browsing behaviors. Audience reports give you more direct, actionable insights than you would be able to gather using your own server data.
One of the most intriguing audience reports is Interests. These insights are a gold mine for advertisers; discover what products your users may be interested in, what product categories your users may have an affinity for, which helps in attracting new users, and lastly, market segments that have a high likelihood of attracting user purchases.
4. Flow visualization: Follow every step
Flow visualization graphics give you the sense of spying on your website visitors.
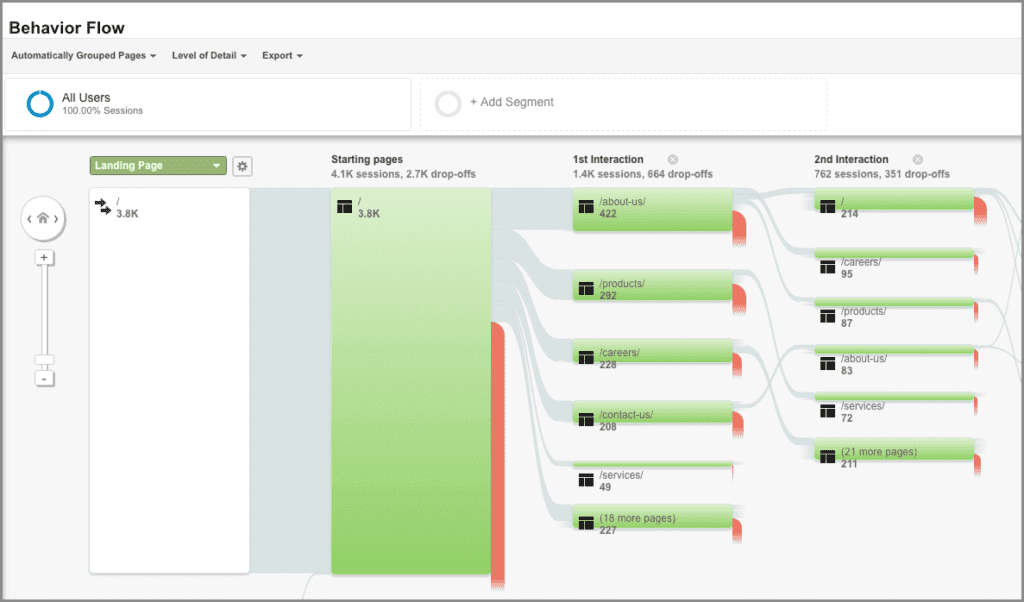
No, not in a creepy way! But these reports allow you to view every step that visitors took as they explored your site, including backtracks. You’ll get a fast snapshot of how they’re engaging with your content and where you may lose them along the way.
Pretty nifty, huh?
There are several flow visualization reports in Google Analytics. One of our favorites is the Behavior Flow report, which portrays how visitors went from one event or page to the next. This report puts the onus on the content versus the channel. For example, you can segment traffic that comes just from Facebook, or email newsletters to evaluate traffic patterns from those sources. You can also segment traffic by isolating keywords.
5. Custom reports: Analytics data, made to order
If you’re a pro with the standard suite of reports, it may be time to dip your toes into custom reporting.
Google Analytics’ custom reports allow you to slice your data exactly how you need it. Carve out your own, unique reports to fit your business goals. If you’re feeling intimidated, a good place to start is by reviewing the Google Analytics Solutions Gallery. There, you can access a slew of custom report templates from the Google Analytics community.
You’ll save a ton of time, with reports already made for insights on things like mobile performance, page timing, keyword analysis and more.
Interested in going out on your own? Make your own custom reports by clicking on the (you guessed it) Customization tab in your top nav. There’s plenty of step-by-step guides that cover every metric and report format.
Implement these five features to experience the full benefits of Google Analytics and maximize your use of the tool. Do you have a favorite feature that you feel is underutilized? Share it with us on Twitter or Facebook!


